Variance by transaction code
The Cash forecasting > Daily treasury > Reports > Cash flow analysis menu enables you to generate reports of your accounts balances by transaction code, giving you detailed information to analyze your cash flows accurately.
- Select Cash forecasting > Daily treasury > Reports > Cash flow analysis.
- In the Accounts field, select the account you wish to display. If you wish to add more accounts, click on + to reopen the list and add an account. You can also select a group of accounts, if you have any. To do so, select the group of your choice, which automatically includes all its accounts. You can unselect an account by clicking on it. This action doesn't remove the account from the group permanently.
- In the Period field:
- Select the type of period to display (Day, Week, Month or Quarter).
- Select the corresponding period to display (in days, weeks, months or quarter).
- In the Date type field, indicate if you wish to display your balances based on their value date or booking date.
- In the Transaction status field, indicate whether you wish to take into account your confirmed and/or non confirmed forecasts.
Note: If you do not check any boxes, Iziago will display the real bank balance of the selected accounts on that date.
- Click on Display variance by transaction code.
Example:
The table in the screenshot below must be read as follows:
- Friday 16th January 2015 displays a beginning balance of 184,006.91 €.
- On that day, there was 16,714.29 € of issued transfers, exclusively composed of operating expenses.
- The day displays an ending balance of 175,292.62 €.
- There was no inflows or outflows on Saturday 17th and Sunday 18th January 2015.
The Total column of the table displays the total amounts by transaction codes over the period you selected. If the table is too long, use the horizontal scrollbar under it to reach the column.
 Click to enlarge
- If you wish, you can:
- Export the report as a PDF file, by clicking on .
- Exports the report as an XLS file, by clicking on .
- Displays the report in full screen, by clicking on .
- Click on Options to modify the display options of the table:
| Option |
Definition |
| Codes linked to a group |
Displays the transaction codes included in the code groups. |
| Distribution by budgetary code |
Displays the budgetary codes within the transaction codes (can be set only if Codes linked to a group is ticked). |
| Reverse totals |
Displays totals by groups of codes after totals by codes (can be set only if Codes linked to a group is ticked). |
| Lines with zero amount |
Displays the lines containing the amounts set to zero. |
| in |
Displays the amount in the selected format:
- Units
- Thousands (K)
- Millions (M)
|
Variance by budgetary code
The Cash forecasting > Daily treasury > Reports > Cash flow analysis menu enables you to generate reports of your accounts balances by budgetary code, giving you detailed information to analyze your cash flows accurately.
- Select Cash forecasting > Daily treasury > Reports > Cash flow analysis.
- In the Accounts field, select the account you wish to display. If you wish to add more accounts, click on + to reopen the list and add an account. You can also select a group of accounts, if you have any. To do so, select the group of your choice, which automatically includes all its accounts. You can unselect an account by clicking on it. This action doesn't remove the account from the group permanently.
- In the Period field:
- Select the type of period to display (Day, Week, Month or Quarter).
- Select the corresponding period to display (in days, weeks, months or quarter).
- In the Date type field, indicate if you wish to display your balances based on their value date or booking date.
- In the Transaction status field, indicate whether you wish to take into account your confirmed and/or non confirmed forecasts.
- Click on Display variance by budgetary code.
Example:
The table in the example must be read as follows:
- Wednesday 14th January 2015 displays a beginning balance of 116,666.84 €.
- On that day, there was 67,340.07 € of operating incomes.
- The day displays an ending balance of 184,006.91 €, which is the beginning balance of the next day.
The Total column of the table displays the total amounts by budgetary codes over the period you selected. If the table is too long, use the horizontal scrollbar under it to reach the column.
Click to enlarge
- If you wish, you can:
- Export the report as a PDF file, by clicking on .
- Exports the report as an XLS file, by clicking on .
- Displays the report in full screen, by clicking on .
- Click on Options to modify the display options of the table:
| Option |
Definition |
| Lines with zero amount |
Displays the lines containing the amounts set to zero. |
| in |
Displays the amount in the selected format:
- Units
- Thousands (K)
- Millions (M)
|
Converting currencies
If you manage bank accounts in different currencies, you can convert the amounts into the currency of your choice. To do so:
- Click on Currency conversion above the table or the chart.
- In the Convert amounts into field, select the currency into which you wish to display the amounts.
- Select a rate table. Note that this field is not displayed if no specific rate per company has been set.
- In Rate value field:
- If you tick Unique rate value, Iziago will use the same rate on the whole period you entered earlier. In Rate date, enter the current date, and in the table, leave the rate value or enter a new one in relation to the reference currency.
- If you tick Rate value at the end of each time unit, Iziago will use a different rate corresponding to each unit of time you selected (day, week, month or quarter).
- Click on Display. The amounts are now displayed in the selected currency.
Click to enlarge
 Click to enlarge
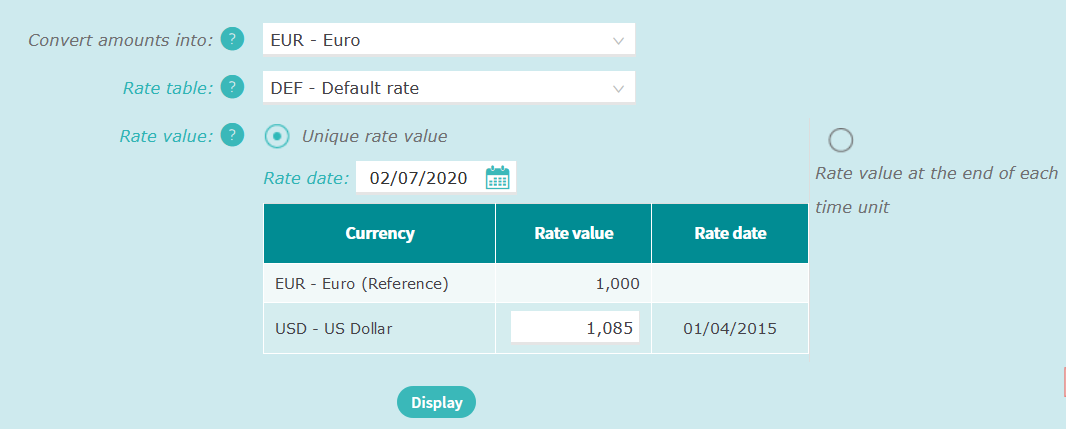 Click to enlarge

